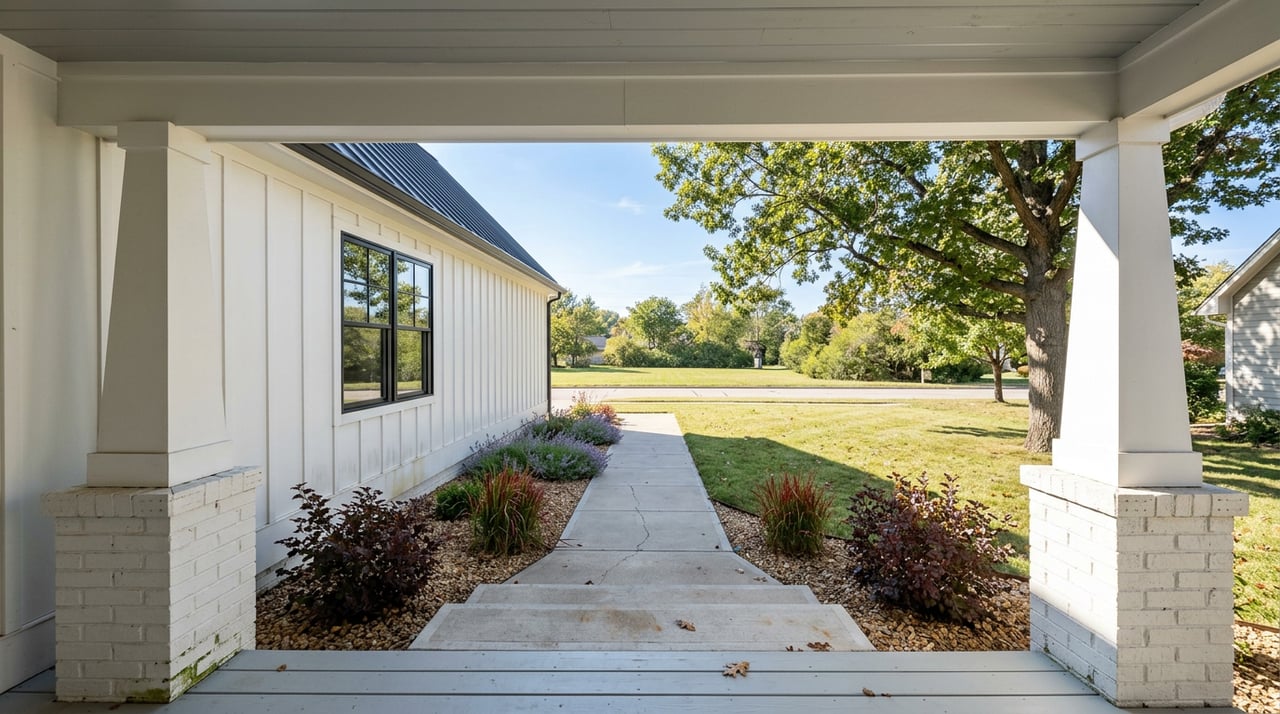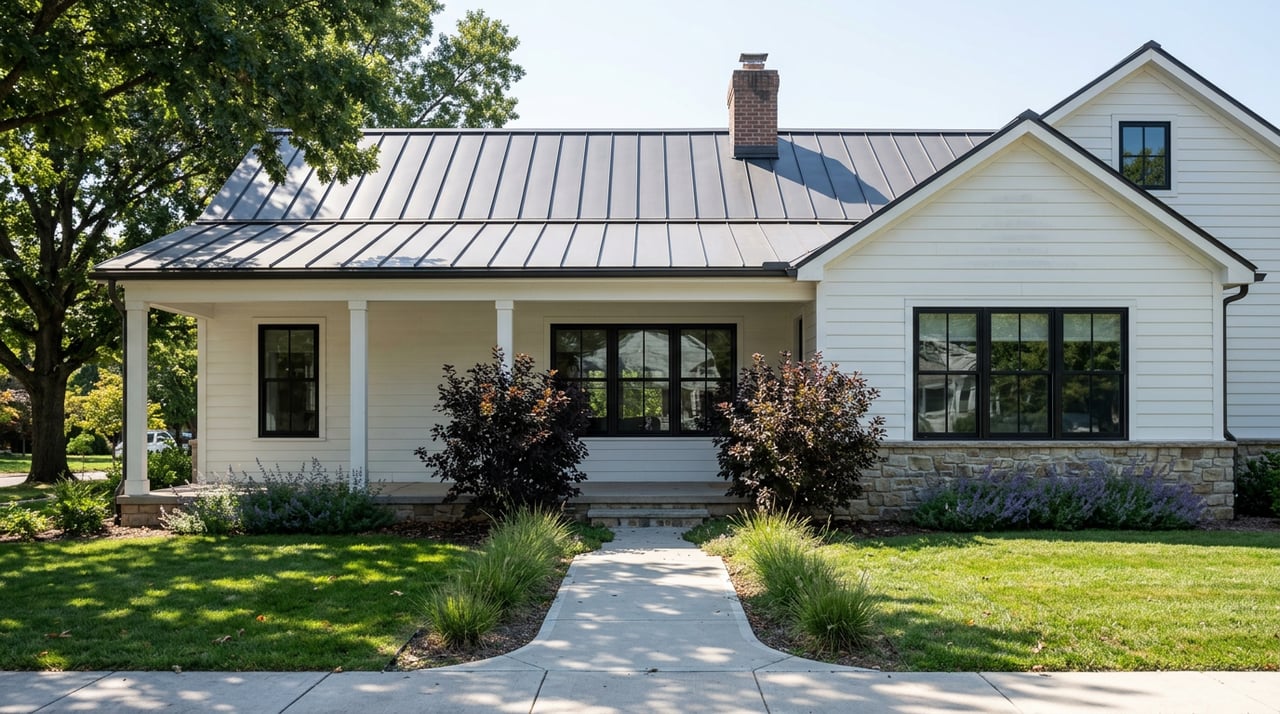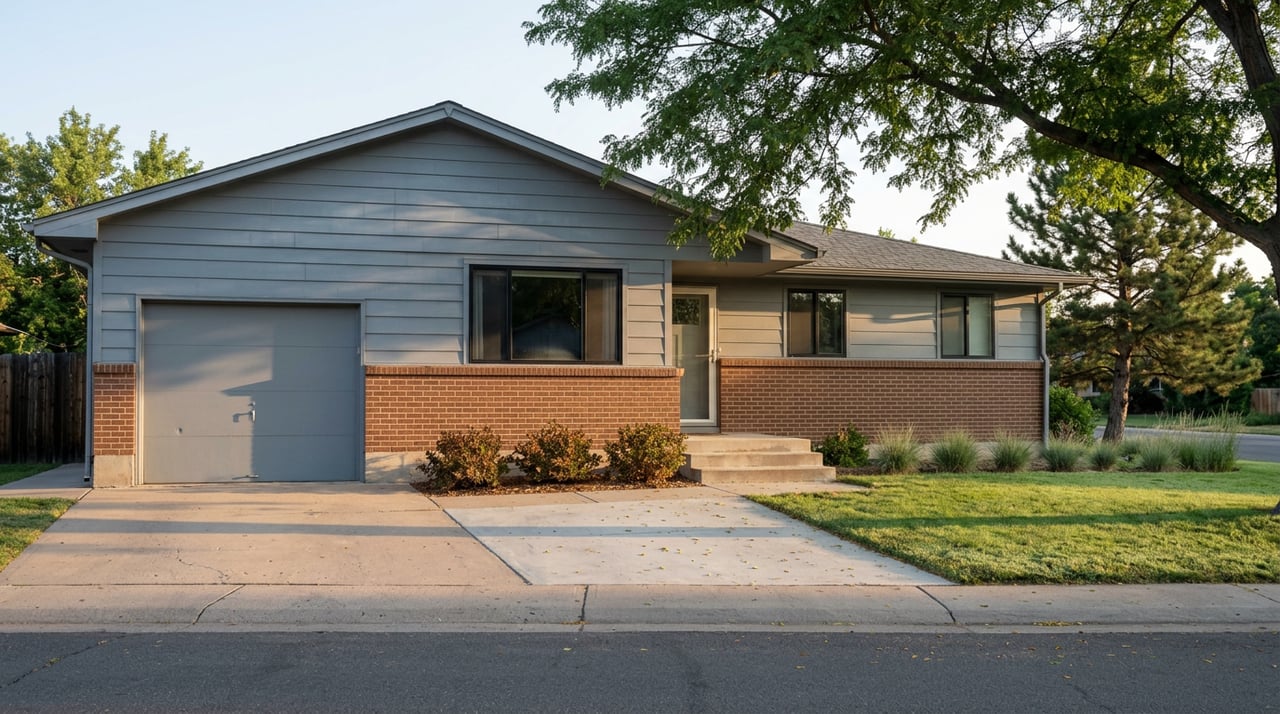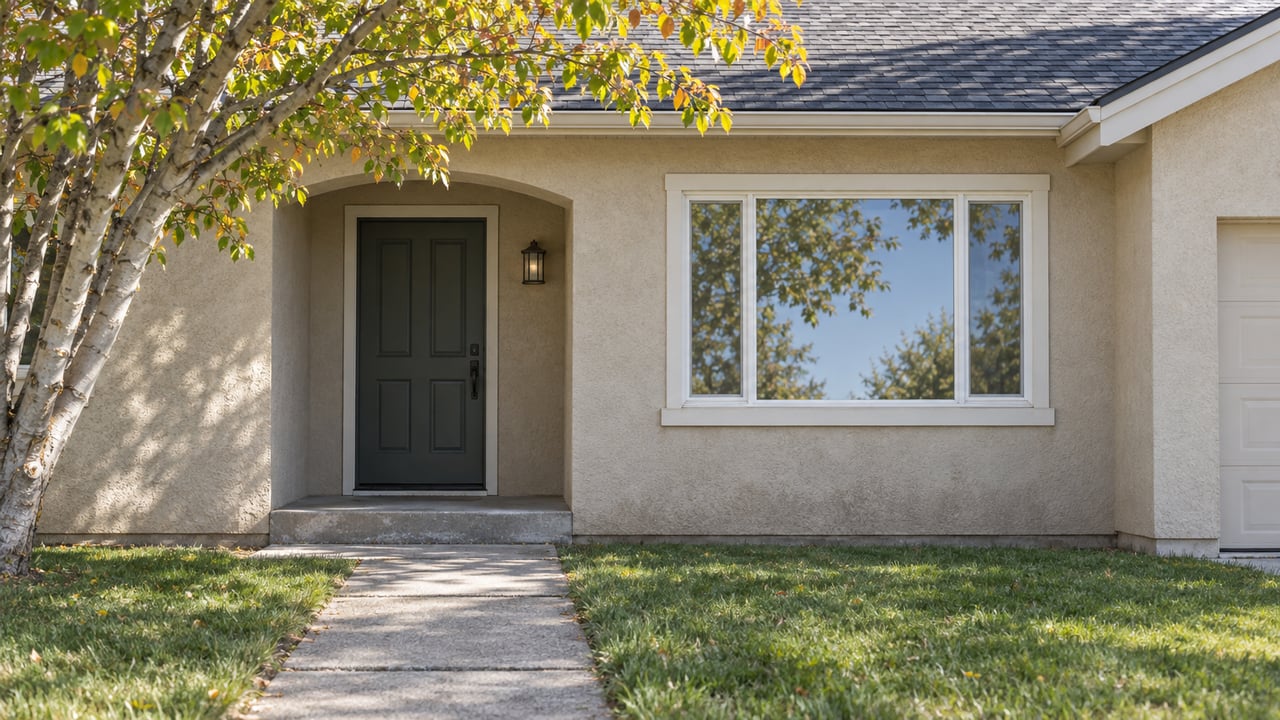
Two homes went under contract in Longmont within days of each other this summer. One was a 1958 bungalow on the Eastside Historic District's tree-lined streets, the kind of place with hardwood floors and a front porch built before anyone thought to call a neighborhood "walkable." The other was a newer build out toward Somerset Meadows, close enough to the Diagonal Highway that the commute to Boulder barely registers. Both sales count toward the same citywide median that shows up when you search "Longmont home prices." Neither one looks anything like the number that search produces.
That number itself is not even fixed. Depending on which data source and which month you check, Longmont's median has landed anywhere from about $557,000 to $575,000 over the course of 2026, with Redfin's three-month window ending June 2026 putting it at $559,000 and a separate market snapshot from September 2026 putting single-family homes at $557,500. Zillow's home value index, measured through June 2026, put the average closer to $557,600, down 2.2 percent from a year earlier. The figures cluster, but they disagree on the decimal, which is the first sign that "the median" is less a fact about Longmont than an average of several different housing markets wearing one zip code.
A quarter-million-dollar gap hiding inside one city
The clearer evidence sits at the ZIP code level. Data from earlier in 2026 put Longmont's 80501 area, which covers the historic core and Eastside Historic District, at a median of roughly $484,000. The 80503 area, home to McIntosh, Longmont Estates, and Somerset Meadows, came in around $731,000 over the same stretch. That's close to a $250,000 spread inside one city, wider than the gap between many entire towns along the Front Range.
A buyer comparing Longmont's citywide median to Boulder's or Louisville's median is really comparing an average of a 1910s cottage market and an executive-home market to another city's own average. The comparison isn't wrong, it's just answering a question nobody asked. The useful question is which Longmont a given budget actually reaches.
Even the ZIP code line is rougher than it looks. Renaissance, the established neighborhood of multi-level homes tucked between Clover Basin Drive and Pike Road with the Diagonal Highway just to the south, sits inside pricier 80503 territory but carries its own median closer to $510,000, well under that ZIP's $731,000 headline. Prospect New Town, the neo-traditional, colorfully built neighborhood in the heart of downtown, sits inside the cheaper 80501 side of the city yet trades at a premium to much of its own ZIP because of its newer construction and walkability. The pattern repeats at every level you zoom into: city, ZIP, neighborhood, block. Averaging any of them together erases the information a buyer actually needs.
| Area | What's there | Recent median |
|---|---|---|
| 80501 (historic core, Eastside Historic District, Prospect New Town) | Bungalows built from the 1900s through the 1950s alongside newer neo-traditional infill near downtown | around $484,000 |
| 80503 (McIntosh, Longmont Estates, Somerset Meadows, Renaissance) | Executive homes near the Diagonal Highway down to established multi-level subdivisions | around $731,000 ZIP-wide, though Renaissance itself runs closer to $510,000 |
The part that contradicts the "buyer's market" headline
Here's where the story gets more interesting than a simple range of prices. Longmont's inventory of single-family homes hit an 11-year high by the end of June 2026, with roughly 300 homes listed for sale. Days on market crept up too, landing around 41 to 42 days through the spring and early summer, compared to closer to 39 a year earlier. On paper, that's the classic setup for a buyer's market: more homes sitting longer should mean sellers giving ground on price.
They mostly aren't. Through the second quarter of 2026, Longmont sellers were closing at roughly 1 percent under their list price, a discount so small it barely counts as negotiating room. Over that same window, sellers in Boulder and unincorporated Boulder County were conceding closer to 2.3 percent, more than double Longmont's gap.
That's backwards from what the headline inventory numbers suggest, and it's worth sitting with why. Boulder and the unincorporated county saw home values climb further and faster between 2020 and 2022, when limited inventory and low rates fed one of the tightest seller's markets the region has seen. That runup left more room to compress once conditions cooled. Longmont's climb over the same years was steadier, so there's less air in the price to let out. A rising inventory count doesn't automatically translate into desperate sellers. It can just as easily mean more homes are coming onto a market where demand hasn't gone anywhere.
Pending sales back that up. By the end of June 2026, pending sales of single-family homes in Longmont were running about 13 percent ahead of the same point a year earlier, and up 5 percent from the month before. Buyers are still showing up. They're just showing up to a wider selection, not a desperate one.
Why the discount gap matters more than the price gap
Part of what's propping up demand is the very price spread this piece opened with. Longmont continues to sell for meaningfully less per square foot than Boulder, and that gap gives Boulder-area buyers priced out of their first choice somewhere obvious to land. Every buyer who can't quite make Boulder's numbers work becomes another offer on a Longmont listing, which is one reason Longmont's sellers aren't conceding the way the inventory count alone would predict.
This shows up differently depending on where in Longmont you're looking. In the entry to mid-price bands, the ones that draw the largest pool of relocating and first-time buyers, competition still compresses days on market even with more homes on the shelf. Move up into the top quarter of the market, the Somerset Meadows and McIntosh tier, and homes tend to sit longer and leave more room to negotiate, simply because that pool of buyers is smaller and pickier by nature.
None of this shows up in a single median. It shows up in the discount rate, the days on market, and the specific submarket a home sits in, three numbers that rarely get quoted together.
What the historic core actually trades for its lower price
The 80501 side of Longmont isn't just the discount option. The Eastside Historic District's National Historic District status comes with a housing stock built between roughly 1900 and 1958, a walk from downtown's restaurants and coffee shops and close to breweries that put Longmont on a lot of people's maps in the first place, including Left Hand Brewing and Oskar Blues, both headquartered in the city. Buying at $484,000 there means buying character and proximity, not a lesser version of the $731,000 home eight minutes north.
The 80503 side trades that walkability for space and newer systems. Somerset Meadows and the McIntosh cluster sit near the Diagonal Highway, which shortens the commute toward Boulder, and near McIntosh Lake Nature Area's 3.5-mile trail loop, a different kind of daily life than a porch on a historic block. Renaissance splits the difference: newer multi-level construction at a price closer to the historic core's than to its own ZIP's average.
Reading a listing against its own submarket, not the city average
The practical shift for a buyer comparing Longmont to its neighbors, or comparing two Longmont listings to each other, is to stop asking whether a price is above or below the city's median and start asking whether it's above or below that specific pocket's own median. A $560,000 listing in 80503 is a genuine value relative to that ZIP's roughly $731,000 average. The same $560,000 in 80501 sits well above that ZIP's typical range and deserves a harder look at what's driving the premium, whether that's a Prospect New Town address, a recent renovation, or something else entirely.
The city-wide numbers still matter as a starting point. They just answer a different question than the one most buyers are actually asking, which is what a specific number buys in a specific place.
If you're trying to figure out where your target price actually lands inside Longmont's submarkets, rather than against a citywide average that may not describe any home you'd want to buy, Barb Passalacqua can run an instant home valuation against the neighborhood you're actually looking at, not the number the portals average together.